
Keywords are the backbone of a good AdWords account. These are the words that are driving your website visitors so they should be focused on achieving your business objectives. The keywords you use should be reflected in your ads and landing page in order to ensure relevance and receive a higher quality score.
As of today, according to internet live stats, there are over 3.8 billion internet users and there have been over 4.3 billion searches on Google so far today. With so many searches, it is important to make sure that the keywords you use are not too broad.
For example, if I’m a plumber and I bid on the word “plumber,” then I will end up paying for clicks from people that are not even looking for a plumber. The traffic derived from internet advertising is not necessarily good unless it is quality traffic from interested consumers.
Instead, it is much smarter to use the same language that someone would type into the browser when looking for your services. A keyword like “plumber near me” would result in much better customer acquisition. One of the best free options for researching keywords is the AdWords Keywords Planner.
So, how do you start? Watch this informative 3-minute tutorial to learn how to use the AdWords Keyword Planner.

Do you want to know how to link your conversion reporting from AdWords & Facebook into one easy to ready report? Read this to find out a free solution from Google.
Today we are going to be building an AdWords & Facebook cost per conversion report using Google Data Studio. This will provide an easy real-time report to view how much it costs you to get a website visitor to convert by the overall accounts, campaigns, and ad groups/ad sets. Make sure you are logged in using the email that you use for your AdWords & Facebook marketing campaigns so that Data Studio can pull the information.
Watch the Online Marketing Techs instructional video or follow the step by step below.
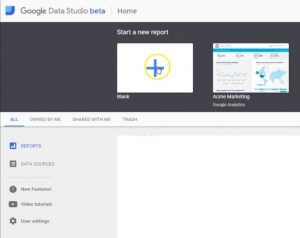
First, we will select start a new report.
Then we will name it. I will name this one E3 Cost Conversion Report.

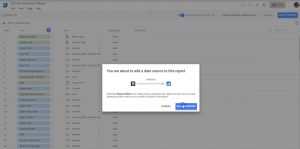
Then we will need to create a new data source.
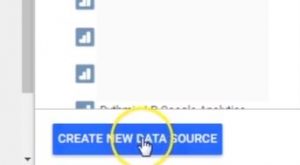
Select your AdWords account and connect.
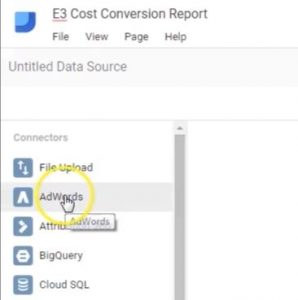

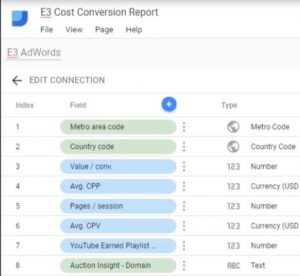
Name your data source and add to report.
![]()
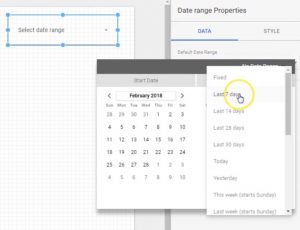
Click on the Insert menu and select the Date range
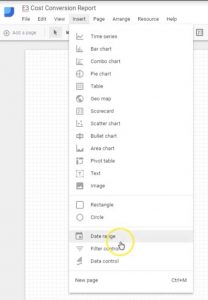
Select the text option from the drop-down menu
![]()
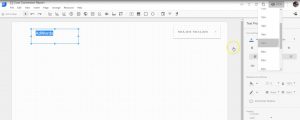
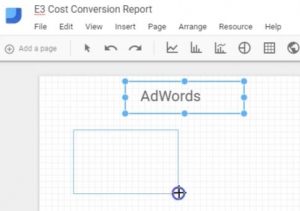
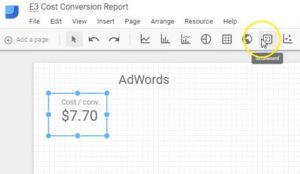
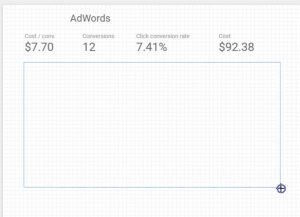
Draw a text box and label it AdWords. You can change the text properties in the property settings on the right-hand side.
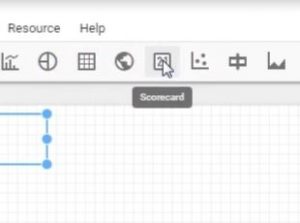
Select the scorecard icon and draw out an icon box.
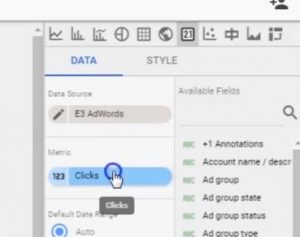
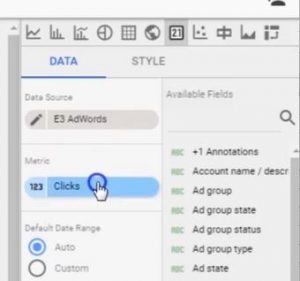
Select the metric picker from the right side of the screen.
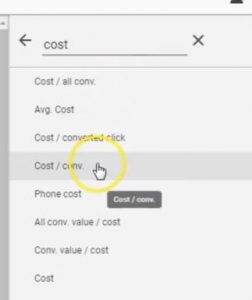
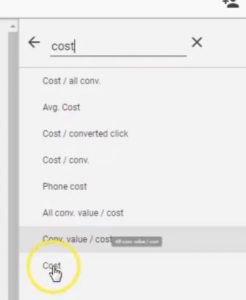
Search for Cost/conv. from the search bar and select the metric.
Select the scorecard icon and draw another icon box.
![]()
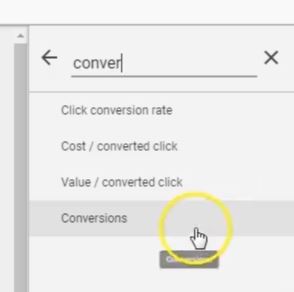
Select the metric picker, search for conversions, and click on the metric.
Select the scorecard icon and draw another icon box.
![]()
![]()
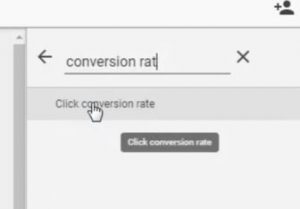
Select the metric picker and search for click conversion rate.
Draw another scorecard, select the metric picker, and search cost.
Select table icon and draw a table box.
![]()
Go to metric picker and search cost/conv.
Now add a metric to the table and search for conversions
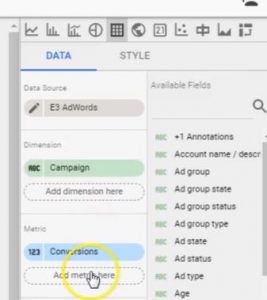
Add another metric and search for click conversion rate.
Add another metric and search cost.
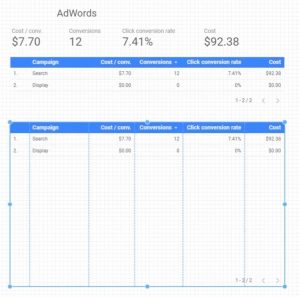
Copy table and paste.
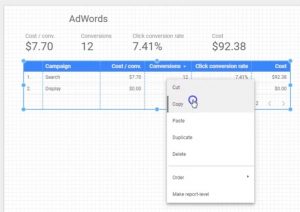
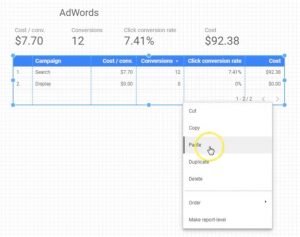
Move the table and resize it to your specifications.
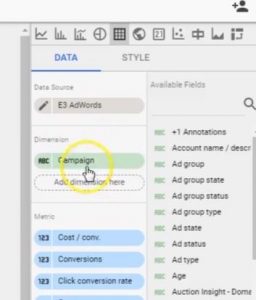
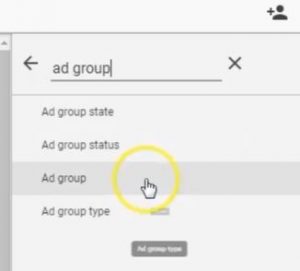
Select the dimension picker and search for ad groups.
Let’s look at the AdWords cost per conversion report.
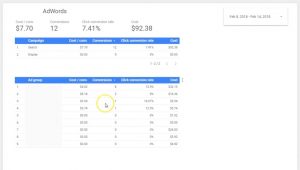
That’s a good looking report.
Watch the video at 5:51 to see how to add the Facebook data.
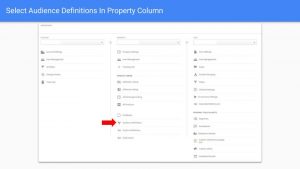
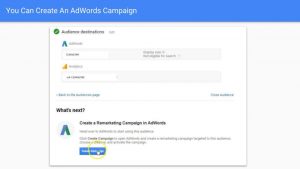
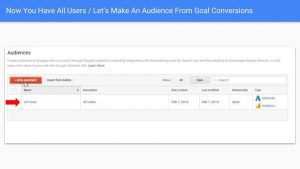
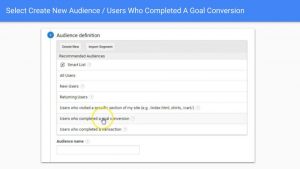
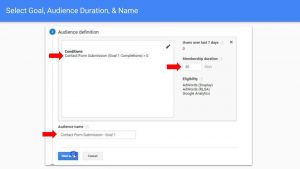
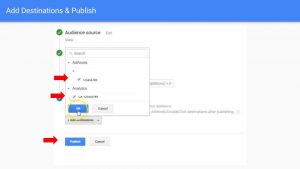
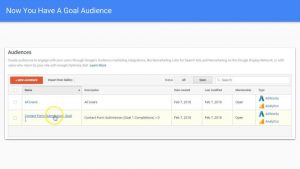
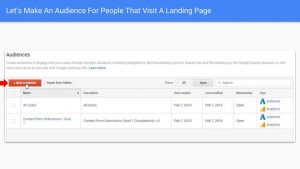
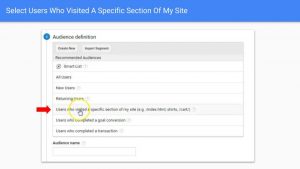
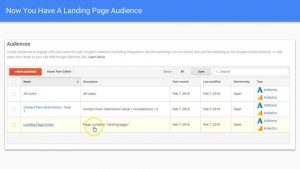
Learn how to use Google Analytics to build custom audiences for all users, goal conversion, and land page visitors. These custom audiences can be used and targeted in AdWords.
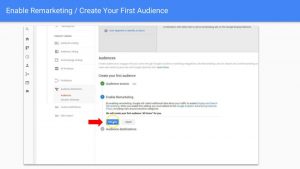
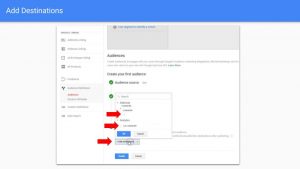
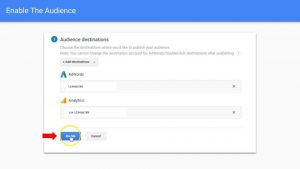
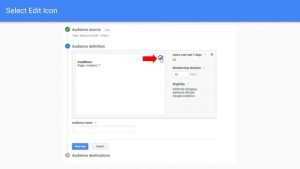
In order to use audiences in AdWords you will need to have your Google Analytics connected with your AdWords account. This step by step tutorial will guide you through your first audience creations.

Whether it’s growth hacking, lead generation, or whatever you want to call it; you need to get traffic to your website in order to get sales. That’s why you need your business to show up at the top of the SERP’s (search engine results pages). You will want to show up for keywords that, when your link is clicked on, will lead to a percentage of the users buying, filling out a lead, or some other conversion that drives your business goals.
The best way to get traffic to your website is to hire professional SEO & online marketing agency like Online Marketing Techs.
However, if this solution doesn’t fit your business, then keep reading. There are two major sources to consider when strategizing to get traffic to your website:


Keywords are the foundation of both organic and paid strategies that get traffic to your website. When a browser user types a query into the search engine, the search engine will return the most relevant results based on the keywords they entered.
For paid search, it is essential to your success that you have quality keywords that will drive your business objectives. It is a best practice to have keywords that are not too broad. For instance if you sell guitars, you wouldn’t want to bid on the keyword “guitars” because you will be paying for clicks from people that are not interested in buying a guitar. A keyword like “guitar store near me” or “buy guitar” would be better choices.

One of the major factors of whether your website will rank in search engines is on-page SEO or search engine optimization. This will tell the search engines whether the code is semantically correct, clean and can help explain to search engines what your web page is about. There are many factors that determine ranking. Just some of the factors that are important to consider concerning on-page SEO are:
Have you ever wondered why some businesses are listed in Google Maps and some aren’t? Have you ever searched a business on Google and seen a widget in the search results that has the businesses website, phone, number, hours, etc.? Well those companies are listed on Google My Business. This is a great way to get traffic to your website using organic methods.
Not only does this give you a type of widget in search results, but it allows you to edit and maintain your business listing in the world’s most used search engine. It also shows your business on Google Maps and allows you to use location extensions in AdWords.
In order to get started, just visit Google My Business and fill out the appropriate information. They will send you a postcard in the mail to your businesses physical address that has a pin number to verify your business. Once you are verified, you will show up on Google Maps, local search, and more.

Videos, eBooks, blogs, articles are all examples of content marketing. Their purpose should be to draw in prospective customers or clients with engaging and relative content that will ultimately result in a profitable action. These should be well thought out content pieces that your customer would really want to engage with.
Every time you create content, it lives on the web and creates links in the search engines. If your content is good enough to rank high for industry specific search terms, then you will gain significant and relevant traffic from each piece that does (especially compounded over time). The more quality content you can create, the better chances you will have of being found. Make sure you use on-page SEO for content published on your website in order to rank well.

This is really a no-brainer. If you’re in business, you need to focus some of your efforts on social media. This could be Facebook & Instagram, Twitter, LinkedIn, etc. Social media is a great place for customers to find and research your business on platforms they are familiar with. All of the engaging content you create can be promoted on social. It also allows your business the ability to reach out and connect with your target audiences.
What’s more, is that search engine use social indicators when ranking web pages. All of the positive actions (liking, sharing, etc.) that happen on social tell the search engines that your business matters. All of your content marketing should be shared on social media.

Technically, YouTube is a social media platform, video sharing application, and a search engine. So, this also falls into the content marketing and social media categories. In fact, after Google, YouTube is the 2nd largest search engine (and is actually owned by Google). So, as you might have guessed, videos that rank well in YouTube also rank well in Google.
However, you want to look at it, YouTube is a terrific way to create and share content as well as grow an organic audience to get traffic to your website.
The best way to achieve this is by having a YouTube channel with quality content your target audience will want to watch that is well optimized with a steady stream of video content. Try to do one video week if you can.
There are many great video ideas and you should try to come up with as many as you can. Some good ideas for compelling YouTube video content include:

A backlink is a link coming from another website to your website. Backlinks are actually at the foundation of search engines and the internet as educational institutions like Stanford would use backlink citations coming from people referencing the content in order to rank the best education articles, studies, and research.
These were once the biggest factors in SERPs ranking as search engines would see that people that find the content valuable would link to it. However, SEO overdid it and forced the hand of search engines to reassess how they factored backlinks.
So, if you have links coming from spammy sites you will actually be penalized. If you get a lot of backlinks at once and then nothing, you will be penalized.
There are two types of links as far as SEO is concerned:
You want to get do-follow links that look natural. Consistently build these links over time so that it doesn’t look spammy. There are many ways to build backlinks, but it takes a lot of work and consistency.
There are several ways to pay for paid traffic.

Search engine marketing uses ads triggered by keywords typed into search engines to entice people to click and buy. When people are researching what they should buy, they go to the search engines. The standard for search engine marketing conversion rate is 1% – 2%. However, Online Marketing Techs average conversion rate for its clients is between 6% – 7%.
I will cover AdWords here. Bind Ads is very similar. In fact, you can import the campaigns you’ve created in AdWords directly to Bing Ads.
When an internet user types a query into the search engine that triggers a specific keyword, advertisers will bid on that keyword. The ad with the highest Ad Rank will win the auction. Ad rank is determined by this equation:
Bid + quality score + expected click-through rate
AdWords and Bing Ads are the main search engine marketing platforms. With both of these you will need to build out:
The Google Display Network (GDN) is comprised of Google Properties and partners sites & applications across the web. This includes YouTube, over 2 million websites, 650,000 apps, Gmail, and Blogger. It allows you to show a type of contextual banner ad of many sizes across the GDN.
The display network offers a plethora of targeting options to reach your target audience. You can target by Topic, Keyword (site content), Interest (user interests), Custom Audiences, Demographics (gender, age, household income), Placements (specific websites, apps, YouTube video or channel), and more.
I recommend only picking one targeting method per ad group. If you have two options selected, both of those criteria must be met in order for the ad to show.
AdWords allows you to create video ads that show on the YouTube Network with TrueView ads. The targeting options are similar to the GDN.
There are 3 main types of video ads you can promote on YouTube:

If you’ve ever searched for a product on Google, you may have seen product ads with images, description, and pricing. Google Shopping allows retailers and product advertisers to promote products across Google Search, Google Shopping, and Google Search Partner websites (including YouTube & Image Search). This uses the CPC bidding and uses the product description in the data feed for targeting. Advertisers typically pay much less for a Shopping ad than a regular text search ad.
In order to advertise on Google Shopping, you will need a landing page where a physical product can be bought, a data feed, Google Merchant Account, and an AdWords Shopping campaign. Other great product advertising platforms include eBay and Amazon.
Extensions allow you to expand your ad with helpful and relevant information. When you use an extension, it also increases your expected click-through rate. Because you are now taking up more of the page and giving more information, you have a greater chance of an internet user clicking on your ad.

Facebook / Instagram, Twitter, and LinkedIn are just a few of the social media platforms to promote your business. These platforms allow you to target your core audiences in many different amazing ways. I will cover some of the Facebook advertising features here.
For those of you that don’t know, Facebook owns Instagram. So when you advertise on Facebook you have the option of displaying those ads on Instagram as well as long as the picture is the appropriate size. Facebook requires you to have a Facebook page in order to market on their network.
When you build a Facebook campaign, you have the option of creating specific types of campaigns that are designed for specific goals. These campaign types include:
In each campaign you will build out ad sets that have your targeting and settings. Depending on the campaign type you are using, your targeting options will vary. Typically you will be able to target by age, gender, location, languages, interests, page interactions, behaviors, detailed targeting, custom audiences, lookalike audiences and more. You will also select if you want to advertise on Instagram or not.
This is where you will put your ad creative. You can connect this to your Facebook page so that any action taken on the ad will be associated with your FB presence. Depending on the campaign type you will be able to show an image or images, video, collection, products (from feed), post, headline, text, display link, news feed link description, and call to action.
All of these methods are great ways to get people to your website; especially when they are all used together. Contact Online Marketing Techs to get more visitors to your website.
Hi. I’m Daniel from OnlineMarketingTechs.com and today, I would like to show you some of the Google Data Studio Connectors. Data Studio. Now Google Data Studio is one of the best analytics reporting platforms that there is. It allows you to import different analytics or online marketing data sources into one place to where you can view real-time reports, update, and really parse out data that you’re not allowed to do on a lot of the individual analytics platforms.
Now, most of these connectors are paid connectors. You have to pay for them. But, they are worth it for some marketers. If you don’t need some of these extra features, then I recommend not getting them. But, if you do, I highly recommend these platforms or one of these connectors that would work best for you and use it for your business. I’m just going to go briefly through some of these connectors so you can see what they have to offer.
Here’s Supermetrics. You’re going to see them a lot. That may be one of the options that you will want to go with. With them, you can import all sorts of social media platforms and their analytics reporting. Bing, AdWords, it’s really fantastic. In fact, we’ll go ahead and look at their landing page real quick so you can see some of the cool stuff. So, you can get a free 14-day trial to see if it’s right for you, or you can buy it now. Here’s a template. That’s a template for Facebook or multiple campaigns. But they’re $19 a month.
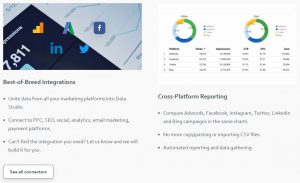
You can unite the data for multiple marketing platforms into the data studio. From PPC, social, email, payment platforms, and all types of different really cool stuff. And if you can’t find out the right integration, they will build one. That’s how good these guys are. Cross-platform reporting. So, in the same charts, you can add multiple connections into the same charts like AdWords, Facebook, Instagram, Twitter, LinkedIn and Bing and all that stuff. If you’ve been doing this before, you don’t have to report CSV files or connect your Google Datasheet (which can be daunting for a lot of advertisers).It gives you automatic reporting and real-time updating. Supermetrics has a lot of really cool things. In fact, a lot of the other connectors that we are going to be showing are from Supermetrics.
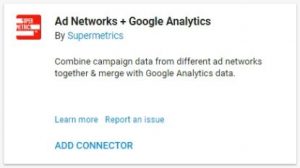
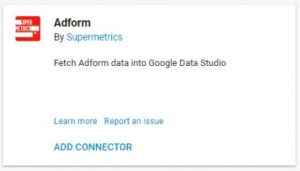
So, they also have Adform. Adform is a marketing platform and Supermetrics allows you to pull your data from that. If you are familiar with Adform, you will be able to pull this in. If you’re not familiar with Adform, this doesn’t matter to you.
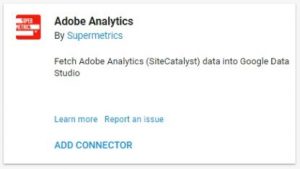
Adobe Analytics… there are a lot of advertisers using Adobe Analytics. It’s a phenomenal platform. Adobe doesn’t do anything that’s not excellent. so, that’s just a fact. So, if you’re using Adobe Analytics, you can import this into data studio and pull from multiple sources.
AdRoll… if you’re using AdRoll, you can import this information. This is from Power My Analytics. Power My Analytics is like Supermetrics. The work a lot, as you can see down here with Amazon and some of these other product selling platforms. If you’re using AdRoll, this may be the way to go for your business.
AdStage is also another automated enterprise platform that would be really excellent to bring into Data Studio, if that’s for you it’s another paid platform.
In fact, let me go back to Power My Analytics and look at their landing page. Let’s see what they have to say. This is the landing page specifically for the AdRoll connector when you activate the app. You can get a 14 day trial just like the others. It’s $9.95 a month. Easy one-time process. Updates you Google Analytics account… Data Studio… tracks ROI from AdRoll. If you’re not familiar with AdRoll, AdRoll they have over 250 advertising platforms that they publish advertising content to. So, it’s really Cool. If you’re using AdRoll, this might be the way to go for you. Let’s go back here.
Now you can automatically get AdWords accounts into Data Studio, but this connector allows you to apply multiple accounts to the same report or the same widget as well. It’s pretty cool, I think you’ll like it. If that’s something you’re interested in. Supermetrics might be the way to go for you.
All Advertising Data by Funnel. It connects 250+ advertising platforms int0 one source. There’s a free trial for them. You might want to check them out. I’m just going to breeze through the rest of these. Some of these might be right for you, but some of them might not.
Products…import the data from that. Same thing. Once you have Power My Analytics, you can add this connector as well.
This may be a great way to go for your business if that’s what you need.
Joins data sets, gets unsampled data from Google Analytics accounts, connects to SQL Server, Redshift, Oracle and more. So, if you want a more tech reporting from your SQL Server and multiple Google Analytics accounts, Redshift, Oracle; you might want to check this out.
Create your own custom reporting using CallRail’s attribution data from your online campaigns through CallRail’s integration. That’s really cool to get some call reporting into your reports.
This is a connector that allows users to create reports with data pulled from one or more data.world datasets using SQL queries. That’s pretty cool.
If you use the DoubleClick Ad exchange, you can view some of the analytics from Supermetrics.
If you’re a product seller using eBay or Amazon, Power My Analytics looks like they might be worth the purchase for your business.

Will fetch facebook page insights into your Google Data Studio.
You’ll see that these are the two top ones. There are a lot of competing ones. Power My Analytics is really more for products. Supermetrics has really awesome social media, from my experience, social media integrations and connectors.

Google Search Console data would be really cool to have in your reporting. You can pull some of these reports from your Google Analytics if you already have this connected to your analytics, but you can also pull it from here.
This is a big one for many businesses. MailChimp… you might want to get Supermetrics for that.
Fetch project ranking data from Marketing Miner into Google Data Studio. So, if you use Marketing Miner, you might want to check out their connector.
This is a free connector that connects to the Facebook Marketing API from Mito. Google actually sent me an email that turned me on to this, and I was like “Yeah, way cool. I like it.” So, I definitely had to check it out. It’s from Mito. You might want to add that connector. At least check it out because Google Data Studio doesn’t automatically have support for Facebook. But if you use Google Sheets and you know how to integrate it with Data Studio, then you can pull the information from that, but it’s not for everybody for sure. So, I really like that they have this one.
Reddit is really cool. So, you may want to pull some data from there. Supermetrics is really, really awesome.

This is kind of new. Being able to have this information could be a game changer for many businesses that use Salesforce. I definitely recommend that if you’re using Salesforce, check this out.
SEMrush is a competitive web analytics research tool. It’s really really cool. I like SEMrush a lot. You can pull a lot of competitive metrics. Basically, you can find out how you’re performing on the search engines and across the web; and how your competitors are. SEMrush is really cool. If you have that, you can pull that information in by Supermetrics.
If you use Stripe, you can pull all of that information in.
If you’re using Twilio for your calls, then definitely check out this.

Here are some open source community connectors and these are really really really cool because they’re free.
Learn more about these. Just go in and find out what’s right for your business or your clients and use these connectors to get the most out of your business if it’s right for you. I highly recommend it.
If you need more help with your online marketing or your analytics reporting, contact us at onlinemarketingtechs.com. Have an excellent day.
Today I got an email from Google Analytics talking about the new user reporting, and so I’d like to check it out.
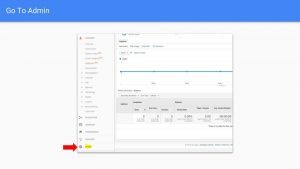
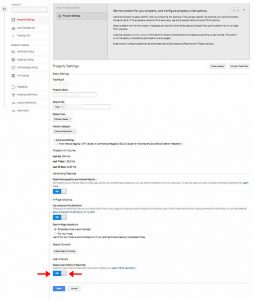
In order to enable it, you go to the Admin > Property Settings then toggle the switch to enable users in reporting.
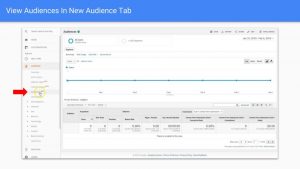
I’ve already got it enabled in here. So, what I’m going to do is just go ahead and show you what it looks like. Here’s the user explorer and here’s there client ID. This is a unique ID that Google Analytics assigns to every device from when your user engages content on your website.
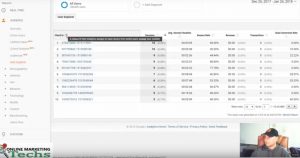
It shows sessions, average session duration, bounce rate, revenue, transactions, and the goal conversion rate. Now, it looks like it only has the transactions from eCommerce. I can’t see the goals or goal conversion. It doesn’t look like there’s a way to change the goals either, but it’s still pretty cool. I can see the goal conversion rate between the different users.
Look at what happens when I click on a user ID.
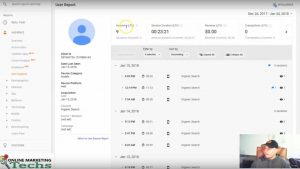
It shows me the sessions. This guy had 9 sessions. The session duration was 23 seconds. It looks like he was pretty engaged and came from organic. You can see all the different sessions he had and the time of the sessions. It shows you the pages they engaged with. That’s pretty cool.
I really like the report. This is super awesome. One thing that I think they could improve is being able to choose the goal. For instance, you have different signups on different pages. One other thing that I would like to see is to have the secondary dimension option to show keywords. Still really good!
Contact Online Marketing Techs for all of your online marketing needs.


Marketing Consultant – Boulder, Colorado – A marketing consultant is responsible for working with businesses to design and institute marketing strategies. The marketing strategies should be focused on achieving the main business objectives of the company (product sales, lead signups, brand impressions, etc.). The marketing consultant will generate a detailed marketing plan, develop the marketing message & content, identify the proper channels to promote your business, put the plan into action, and optimize the strategy based on performance data.
The consultant should have knowledge of the consumer behaviors, market performance statistics & predictions, as well as the tools & platforms used to institute the marketing strategy. Then the consultant will position the business offerings to a narrowly targeted audience and draw interest from potential customers.
Boulder is unlike any other City, and marketing a Boulder business (or to Boulder locals) requires a unique approach. It is important to consider a consultancy like Online Marketing Techs that has this unique approach in mind when creating your strategies and messaging. People are looking for what your business offers, but needs the right positioning and messaging to convince them that your products or services are the right fit.
Before you even build your business, you should know if there is a need for what your business offers. A market consultant can help you identify the demand and if your business has a good chance of success or not. The consultant will also help you Identify your top competitors and take notes of the advantages your business has over them. What are they doing to generate sales? What is your unique selling proposition? The answers to these questions should be noted and considered while creating your targeting and messaging.
It is essential that you know who your customers are. This is the part of the research phase that identifies the different profiles of your consumer demographics. A good consultant will help you build out these buyer persona’s so that you can tailor your messaging to sell to these specific profiles. If you already have sales, you may have access to some of this information already. It is great to generate interest, but it is even better to generate interest from the people that are most likely to buy. This is especially important when building custom audiences in display, video and Facebook marketing.
Your marketing consultant should be fluent in analytics in order to optimize your strategies and produce the best results. The industry consumer base of every business is constantly changing and evolving. It is important that you can identify trends, channels, messaging, targeting, etc. that work and which ones that don’t so that you can focus your resources on achieving your business goals. Your consultant should be well-versed in:
KPI’s or key performance indicators are metrics that you can measure in order to see if you are making progress toward reaching your overall business objectives. In online marketing, some of the basic KPI’s include
You will want to make sure your website and marketing analytics are set up to receive these metrics as well as dimensions like:
Make sure you chose a knowledgeable Boulder Marketing Consultant to drive sales for your business. Contact Online Marketing Techs now.

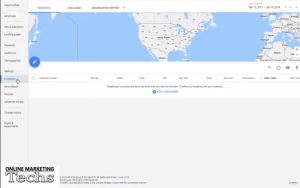
So, today I’m going to show you how to set locations in AdWords and how to set bid adjustments based on data you’ve received. First, you’ll select the campaign you want. Then you will go in and select locations. You’re going to want to go up here and hit the geographic report. Since we’re targeting the United States, I’ll just select that. You can select the region, state, Nielsen regions, congressional district, county, municipality, city, postal code airport, borough, city region, neighborhood, university, and district. I’m going to select the state. Select all. I’m going to add target and set bid adjustments, but I’m not going to actually set the bid adjustment just yet. Save. Now, I’ll see that I have all of these targeted now, and I can set bid adjustments based on the data. I have this collum set to cost per conversion. I want the highest cost per conversion so I can set a bid adjustment based on “that’s too high for me.” Really, in this campaign, it’s not too high for me. But, since it’s significantly higher in Wisconson, I think I can pay less for that and I’m going to decrease by 5%. I’ll come back in a week and see what Wisconson looks like, and based on the data I’ve received because I’ve put enough money into this campaign, I know that a week is enough data for me to see that this will either be performing the way I want to or not. I’ll check and see how high of a cost per conversion. Now, I want to see what’s costing me the most. California comes in at 353 clicks. That’s significantly higher than the rest and it’s costing me $55.02. But, I get a good cost per conversion and this is a good portion of my audience for this campaign specifically. I can also see here what is also costing me and not converting. This cost me $0.32, Missouri. I could set a bid adjustment on that. But, I might monitor that for another week or so and see if we don’t get any conversion in there, I might decrease by 5% and just keep bumping it up if I don’t see conversions. In fact, right now, I’ll go ahead and decrease this for Missouri because in the last 30 days there hasn’t been a lot of conversions for Missouri. Nevada $0.32 – Washington – New York. I’m going to monitor the rest of these for now. Missouri is not really a highly targeted one for this specific campaign based on what we’re trying to sell, they’re not a high demographic. So, now you know how to set your locations. You can set your bid adjustments. Use the data right here. If you’re looking for more impressions, you’re trying to brand more you’ll want to focus on impressions and maybe set higher bid adjustments for that. Or, if you’re trying to see more traffic, you know, see where you’re getting the most clicks, focus on those. If you’re trying to get a lower cost per click, focus on the data that’s important to you. For me, really, right now, it’s about cost per conversion and cost and my conversion data. I hope I’ve helped you out. Don’t forget to subscribe. And if you need any help, contact Online Marketing Techs at onlinemarketingtechs.com to help you out with your online marketing needs.
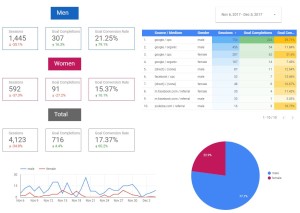
One of our clients wanted to perform a test to see how a specific targeting for an online marketing campaign would affect gender conversions. Data studio provides the ability to build a demographics gender report to view and share with your client’s, partners, or associates. My love of Google Data Studio gave me the inspiration to generate this gender conversion report. The report allowed us to see with great detail if the targeting test was successful or not. Hope it helps you with your gender conversion reporting.
Want to see how Online Marketing Techs can help you with your online marketing?

online marketing analytics tips & tricks
Okay, so today I’m going to be showing you how to build a gender report in Google Data Studio pulling from your Google Analytics. So, let’s get started. Just type Google Data Studio into Google. Pull it up. Then you can select a template, but we’re going to select a blank report. Title it Gender Report.
Now, we need to add a data source. You can select from ones that you’ve already connected or you will need to connect to a new one. We’ll go in there and connect to Google Analytics and select the account, property, and view. Connect. Alright, you’ll want to add that to the report. Click on that. But, I’m going to select one that I already have. There we go. We’ll add it to the report.
Alight, so we’re going to start out with a date range. You’re going to want to select what date you want to pull the data from. We’re going to go ahead and select the date range to automatically be 30 days. You can change this on the front side to be whatever date you want. But, for now, we’re going to set it to be 30 days.
Now, we’re going to build out the labels. Make it a little bigger. I’m going to make it white because I want it on a blue background. I’ll type in men. Make the background blue.
Now, we’re going to insert a scorecard.
It’s automatically set to sessions. We want the sessions in there for sure. We’re going to compare it to the previous period. So, this is the previous 30 days. We’re going to make a little blue box around it.
So, I’ve got my sessions in there. I’m going to add a filter so it only shows from the men. I’ll select include, gender is equal to male. Save. Now I have my filter. I’ll go ahead and copy that. Paste. Move it over.
Now, I want to select a different metric (in my metric picker) I want to select completions (goal completions). You can select any goal completions you want, but I’m going to go with all of them right now. It’s a total overview. Copy that. Paste. Select the new metric. I want to know the conversion rate. There it is. Be sure we have our filters on them. There’s our men category, sessions, goal completions, goal conversion rate. I’m going to select them all and copy. Paste. I’m going to change the name to women. I want to make it a specific color so I can tell the difference. You can make it any color you want.
Now, I’m going to make a table so I can view the different data sources and mediums that different genders come from. So, it automatically has all the sessions from the different sources, but I want to see the different sources and mediums. So I’m going to type in source and select Source / Medium. I want to know what gender it’s from. So I add another dimension gender. Select metric goal completions. Select a new metric conversion rate. You can adjust them to be the right size. However, you want to do it.
Now, I’m going to make a little heatmap that will show the highest numbers at the top. It will basically tell you what’s performing best for that metric. What’s getting the highest numerical value? You can adjust the colors to be whatever you want. There you go.
I’m going to add a new pie chart so we can basically see who’s getting the most men or women. We want to know which ones have completed the goals. When we’re working with these pie charts you can select how many different pie slices you want. This one you only have the two options because of gender. Men and women are the only options that you have. You can change the color. You can change the color of the pie slices. It’s pretty fun to work with.
Alright, so now I’m going to make the time series so we know which days we had which action from which gender. We want to know goal completions. We’ll add the secondary dimension as gender because the first one is time. And, there it is.
You can also show how many show on the first page or part of the widget. 20, 10 different ones. You know. This one only has 10 so it will only show 10. You can mess around with that. You can view it. Make it look how you want. This is a pretty cool report.
Let’s not forget. We need to go back and we need to change the filter for the women. Create a new filter. This should be the women filter. Include gender is equal to female. There you have your filter. You’ll apply it to the appropriate fields ( the appropriate widgets).
Now we have the men and the women, but there’s an unknown gender amount. So, we’re going to have the total. If you add together the men and the women you’ll have the ones that you know and you take that and subtract that from the total, you’ll have the unknown gender (the ones that Google doesn’t know or don’t provide). Let’s make this one gray. There you go. let’s get rid of the filter. There you have it.
That’s your gender report. You can view it. You can change the date ranges and get all the right data that you need.
You can also duplicate this page. Let’s say we only want to show one that is coming through from AdWords. You can duplicate and rename this page AdWords. Let’s rename the first page to total. We’ll want to leave the source because this is all coming from one source. We’ll add the filter. Create the filter. I already created it, but I’m going to show you how I created it. We’ll go into there. The Source / Medium is google / cpc. Include Source / Medium equals to google / cpc. Save.
Now you will go through and add this to all of the widgets. You can do this for any source. You can make your own filters. Feel free to play around with it to get the data you want. Arrange it to where it looks the best for you. There it is.
I hope you guys liked it a lot and were able to build your own gender conversion data. Feel free to subscribe and thanks for watching. Bye.
Want to see how Online Marketing Techs can help you with your online marketing?
Recent Comments