
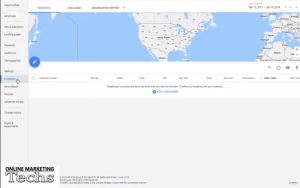
So, today I’m going to show you how to set locations in AdWords and how to set bid adjustments based on data you’ve received. First, you’ll select the campaign you want. Then you will go in and select locations. You’re going to want to go up here and hit the geographic report. Since we’re targeting the United States, I’ll just select that. You can select the region, state, Nielsen regions, congressional district, county, municipality, city, postal code airport, borough, city region, neighborhood, university, and district. I’m going to select the state. Select all. I’m going to add target and set bid adjustments, but I’m not going to actually set the bid adjustment just yet. Save. Now, I’ll see that I have all of these targeted now, and I can set bid adjustments based on the data. I have this collum set to cost per conversion. I want the highest cost per conversion so I can set a bid adjustment based on “that’s too high for me.” Really, in this campaign, it’s not too high for me. But, since it’s significantly higher in Wisconson, I think I can pay less for that and I’m going to decrease by 5%. I’ll come back in a week and see what Wisconson looks like, and based on the data I’ve received because I’ve put enough money into this campaign, I know that a week is enough data for me to see that this will either be performing the way I want to or not. I’ll check and see how high of a cost per conversion. Now, I want to see what’s costing me the most. California comes in at 353 clicks. That’s significantly higher than the rest and it’s costing me $55.02. But, I get a good cost per conversion and this is a good portion of my audience for this campaign specifically. I can also see here what is also costing me and not converting. This cost me $0.32, Missouri. I could set a bid adjustment on that. But, I might monitor that for another week or so and see if we don’t get any conversion in there, I might decrease by 5% and just keep bumping it up if I don’t see conversions. In fact, right now, I’ll go ahead and decrease this for Missouri because in the last 30 days there hasn’t been a lot of conversions for Missouri. Nevada $0.32 – Washington – New York. I’m going to monitor the rest of these for now. Missouri is not really a highly targeted one for this specific campaign based on what we’re trying to sell, they’re not a high demographic. So, now you know how to set your locations. You can set your bid adjustments. Use the data right here. If you’re looking for more impressions, you’re trying to brand more you’ll want to focus on impressions and maybe set higher bid adjustments for that. Or, if you’re trying to see more traffic, you know, see where you’re getting the most clicks, focus on those. If you’re trying to get a lower cost per click, focus on the data that’s important to you. For me, really, right now, it’s about cost per conversion and cost and my conversion data. I hope I’ve helped you out. Don’t forget to subscribe. And if you need any help, contact Online Marketing Techs at onlinemarketingtechs.com to help you out with your online marketing needs.

 Online Marketing Boulder, Colorado
So, you’ve got a great business with a wonderful unique selling proposition. Now how do you target the right people and attract them to your business? Obviously, you will want to focus your marketing efforts on where your customers are going to be found. It doesn’t matter whether you are a local Boulder, Colorado business or not; you need to market your business in order to make it grow.
If you are familiar with Boulder, Colorado, you will know that people here march to the beat of their own drum. That goes for businesses as well. Boulder isn’t a normal place and neither are the businesses that make the community thrive. That is why attracting the right audience is so essential to your business. You need an online marketing approach that speaks to your audience.
As everyone in Boulder is constantly online, for most businesses the best approach is through online marketing platforms like AdWords & Facebook Ads. This is because the majority of internet users search through Google, and a very high portion of overall internet usage can be attributed to time spent on Facebook. So, no matter who your target customer is, a significant portion of them are using these fantastic products.
Clients have asked me which one of these platforms they should advertise on. Honestly, there is no one answer. I think both are wonderful, but for some clients, I have seen one work better over the other. A lot of this has to do with the targeting, optimization, and messaging. So let’s break down the advantages of both of these.
AdWords has the ability to target and reach people through Google Search, the Google Display Network (and partner sites), and the Google Shopping Network. The targeting options can be extremely in-depth and allow you to target and optimize for the right audience. AdWords is really a beast so I won’t even get into all of the amazing targeting options (which include being able to set bid adjustments).

Facebook allows you to use a myriad of ads to people on Facebook and Instagram. Along with AdWords, Facebook Ads has its own unique targeting abilities. You can target by so many different interests and affinities as well as demographic information that it is really insane. Some of the targeting options allow you build audiences to show your ad that includes, excludes, or combines lists based on the following:
I recommend using both online marketing platforms if possible. Either way you go, you will need to track, analyze, and optimize in order to be successful on the web.
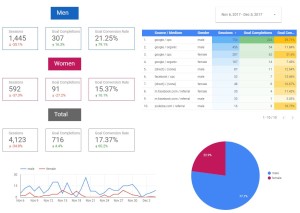
One of our clients wanted to perform a test to see how a specific targeting for an online marketing campaign would affect gender conversions. Data studio provides the ability to build a demographics gender report to view and share with your client’s, partners, or associates. My love of Google Data Studio gave me the inspiration to generate this gender conversion report. The report allowed us to see with great detail if the targeting test was successful or not. Hope it helps you with your gender conversion reporting.
Want to see how Online Marketing Techs can help you with your online marketing?

online marketing analytics tips & tricks
Okay, so today I’m going to be showing you how to build a gender report in Google Data Studio pulling from your Google Analytics. So, let’s get started. Just type Google Data Studio into Google. Pull it up. Then you can select a template, but we’re going to select a blank report. Title it Gender Report.
Now, we need to add a data source. You can select from ones that you’ve already connected or you will need to connect to a new one. We’ll go in there and connect to Google Analytics and select the account, property, and view. Connect. Alright, you’ll want to add that to the report. Click on that. But, I’m going to select one that I already have. There we go. We’ll add it to the report.
Alight, so we’re going to start out with a date range. You’re going to want to select what date you want to pull the data from. We’re going to go ahead and select the date range to automatically be 30 days. You can change this on the front side to be whatever date you want. But, for now, we’re going to set it to be 30 days.
Now, we’re going to build out the labels. Make it a little bigger. I’m going to make it white because I want it on a blue background. I’ll type in men. Make the background blue.
Now, we’re going to insert a scorecard.
It’s automatically set to sessions. We want the sessions in there for sure. We’re going to compare it to the previous period. So, this is the previous 30 days. We’re going to make a little blue box around it.
So, I’ve got my sessions in there. I’m going to add a filter so it only shows from the men. I’ll select include, gender is equal to male. Save. Now I have my filter. I’ll go ahead and copy that. Paste. Move it over.
Now, I want to select a different metric (in my metric picker) I want to select completions (goal completions). You can select any goal completions you want, but I’m going to go with all of them right now. It’s a total overview. Copy that. Paste. Select the new metric. I want to know the conversion rate. There it is. Be sure we have our filters on them. There’s our men category, sessions, goal completions, goal conversion rate. I’m going to select them all and copy. Paste. I’m going to change the name to women. I want to make it a specific color so I can tell the difference. You can make it any color you want.
Now, I’m going to make a table so I can view the different data sources and mediums that different genders come from. So, it automatically has all the sessions from the different sources, but I want to see the different sources and mediums. So I’m going to type in source and select Source / Medium. I want to know what gender it’s from. So I add another dimension gender. Select metric goal completions. Select a new metric conversion rate. You can adjust them to be the right size. However, you want to do it.
Now, I’m going to make a little heatmap that will show the highest numbers at the top. It will basically tell you what’s performing best for that metric. What’s getting the highest numerical value? You can adjust the colors to be whatever you want. There you go.
I’m going to add a new pie chart so we can basically see who’s getting the most men or women. We want to know which ones have completed the goals. When we’re working with these pie charts you can select how many different pie slices you want. This one you only have the two options because of gender. Men and women are the only options that you have. You can change the color. You can change the color of the pie slices. It’s pretty fun to work with.
Alright, so now I’m going to make the time series so we know which days we had which action from which gender. We want to know goal completions. We’ll add the secondary dimension as gender because the first one is time. And, there it is.
You can also show how many show on the first page or part of the widget. 20, 10 different ones. You know. This one only has 10 so it will only show 10. You can mess around with that. You can view it. Make it look how you want. This is a pretty cool report.
Let’s not forget. We need to go back and we need to change the filter for the women. Create a new filter. This should be the women filter. Include gender is equal to female. There you have your filter. You’ll apply it to the appropriate fields ( the appropriate widgets).
Now we have the men and the women, but there’s an unknown gender amount. So, we’re going to have the total. If you add together the men and the women you’ll have the ones that you know and you take that and subtract that from the total, you’ll have the unknown gender (the ones that Google doesn’t know or don’t provide). Let’s make this one gray. There you go. let’s get rid of the filter. There you have it.
That’s your gender report. You can view it. You can change the date ranges and get all the right data that you need.
You can also duplicate this page. Let’s say we only want to show one that is coming through from AdWords. You can duplicate and rename this page AdWords. Let’s rename the first page to total. We’ll want to leave the source because this is all coming from one source. We’ll add the filter. Create the filter. I already created it, but I’m going to show you how I created it. We’ll go into there. The Source / Medium is google / cpc. Include Source / Medium equals to google / cpc. Save.
Now you will go through and add this to all of the widgets. You can do this for any source. You can make your own filters. Feel free to play around with it to get the data you want. Arrange it to where it looks the best for you. There it is.
I hope you guys liked it a lot and were able to build your own gender conversion data. Feel free to subscribe and thanks for watching. Bye.
Want to see how Online Marketing Techs can help you with your online marketing?
Recent Comments